CASE STUDY 03 / PYTHON · PANDAS · MATPLOTLIB
Hotel Booking & Inventory Analysis
A Python/Pandas exploration of synthetic resort bookings, combining inventory, room nights, revenue, cancellations, and booking lead times.
Completed project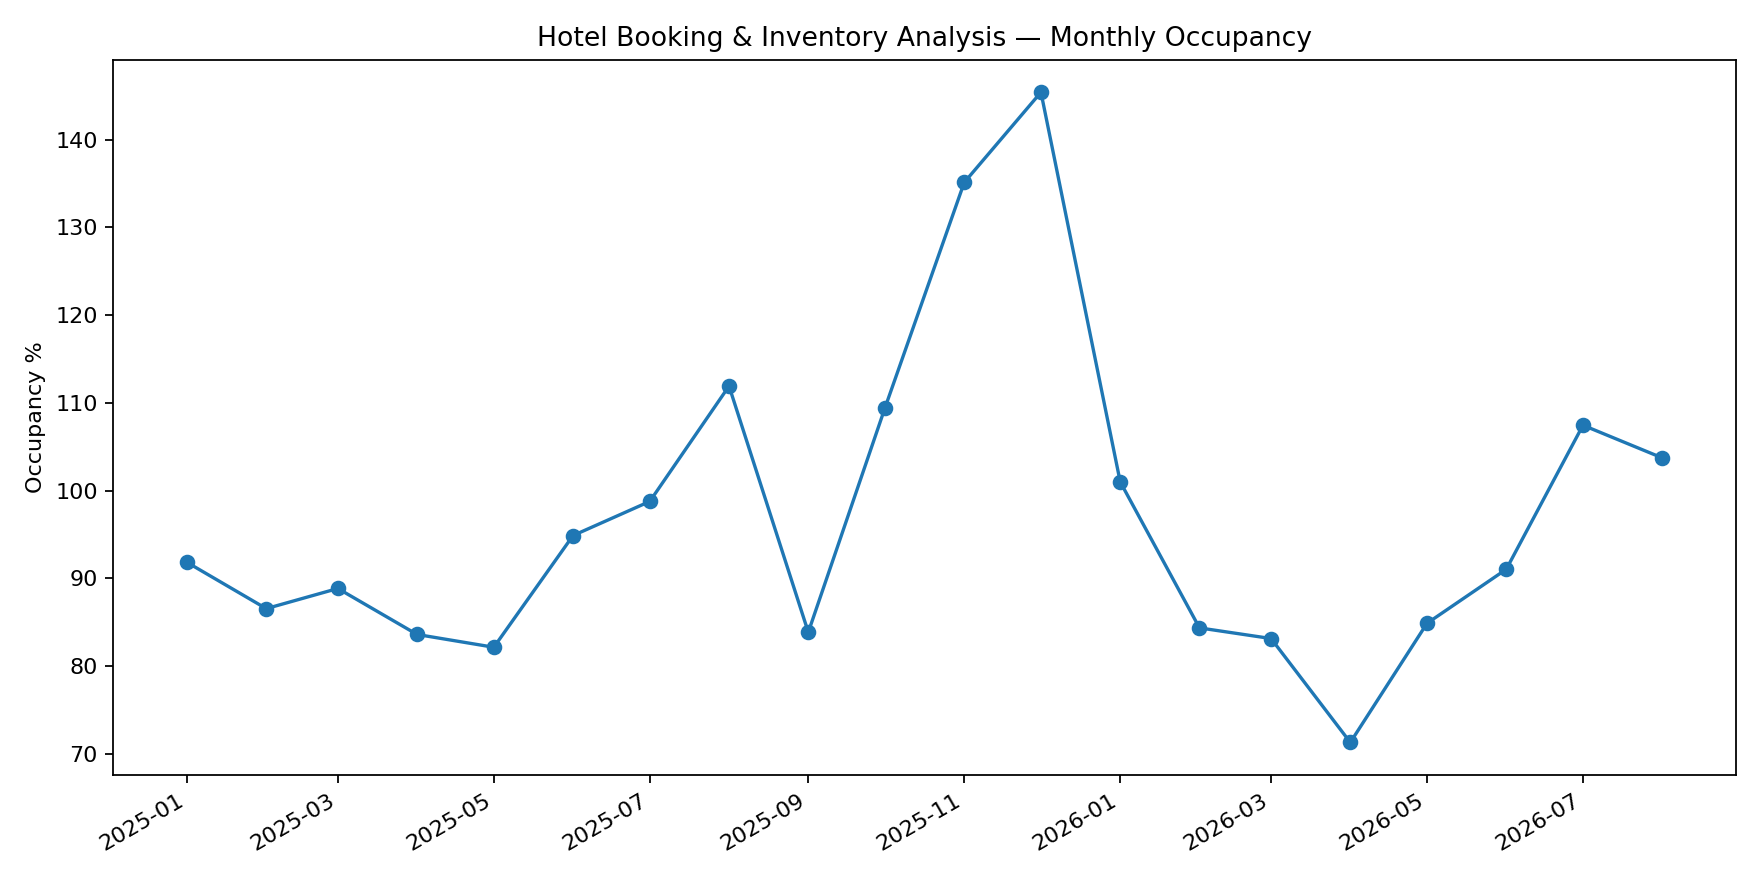
01
Problem
How do bookings translate into inventory utilisation and revenue, and how do cancellation rates and lead times differ by booking channel? The project explores why booking count alone cannot describe a property’s performance.
02
Data
Synthetic booking and room-inventory CSVs representing a 13-unit resort from January 2025 to August 2026. Booking records include booking and stay dates, cancellation status, nights, rates, booking value, channel, and lead time. These are portfolio data, not records from a real property.
03
Approach
Loaded the CSVs with Pandas, parsed dates, and checked for duplicate booking IDs and missing values. Excluded cancelled bookings from the monthly room-night and revenue calculations. Grouped active bookings by check-in month and calculated available room nights as days in the month multiplied by the inventory’s total units.
04
Analysis
Calculated monthly booking counts, room nights, booking-value revenue, occupancy, and RevPAR, with a Matplotlib occupancy trend. The script also calculates mean nightly rate per booking, labelled ADR, and channel-level cancellation rates and average lead times.
Method limitations: whole stays are assigned to check-in month rather than allocated across individual stay dates. ADR is an unweighted mean of booking nightly rates, rather than room revenue divided by sold room nights. Non-cancelled booking value is treated as realised revenue; cancellation status alone does not confirm completed stays or payment.
05
Insights
The supplied output reaches 145.4% occupancy in December 2025 and falls to 71.3% in April 2026. Occupancy above 100% is a validation warning, not a feasible capacity result for the stated inventory. The synthetic bookings, inventory assumptions, and allocation of nights need reconciliation before these monthly utilisation figures can support operational decisions.
Agoda has the highest reported cancellation rate at 18.7%, compared with 7.2% for Direct bookings. Direct bookings also have shorter lead times than OTA-heavy channels. These are descriptive patterns in synthetic data, not evidence that a channel causes cancellations.
06
Outcome
Delivered a Python analysis script, Jupyter notebook, source data, monthly KPI and channel summaries, and an occupancy chart. The project connects booking records to inventory-based measures and channel analysis.
Before applying this model to a real property, allocate room nights by stay date, reconcile daily and room-category capacity, calculate room-night-weighted ADR, and confirm realised revenue against completed stays or payments. The preview reproduces the repository’s original output, including the occupancy anomaly; no corrected or real-world results are claimed.