CASE STUDY 01 / POWER BI · POWER QUERY · DAX
Northstar Retail Sales Analysis
An end-to-end Power BI analysis of retail revenue, discounting, and profitability—investigating margin compression and a mid-year growth slowdown.
Completed project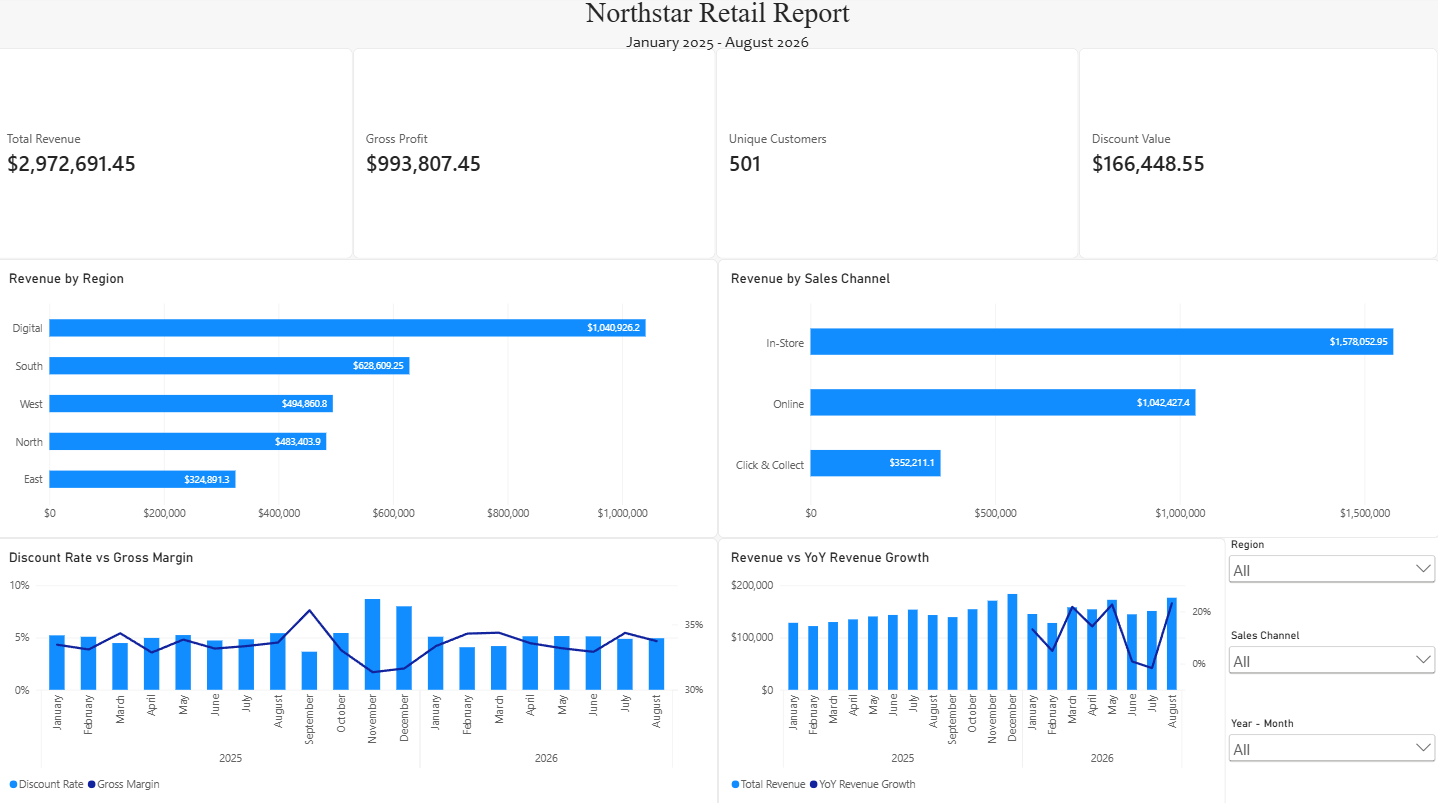
01
Problem
What explains changes in Northstar Retail’s revenue and profitability between January 2025 and August 2026? The goal was to build a reliable analytical model and executive dashboard, then investigate meaningful performance changes beyond headline totals.
02
Data
Excel source data covering January 2025–August 2026. Sales records have one row per transaction; targets have one row per month, region, and sales channel. The model uses Calendar, Customers, Products, Stores, Region, and Sales Channel dimensions. This is a portfolio analysis; its findings describe the supplied dataset.
03
Approach
In Power Query, corrected numeric date fields, standardized sales-channel text, and removed a transaction duplicate only after confirming both records were identical. Preserved a valid sale referencing missing customer C9999 by adding an Unknown Customer member, without inventing customer attributes. Kept Sales and Targets as separate fact tables linked through shared dimensions to avoid multiplying monthly targets across transactions.
04
Analysis
Created DAX measures for revenue, gross profit, gross margin, distinct customers, potential revenue, discount value and rate, and year-over-year revenue change and growth. Built an executive dashboard with revenue by region and channel, discount rate versus gross margin, revenue versus YoY growth, and region/channel/year-month slicers. Investigated category margins and store-level growth to distinguish broad trends from concentrated declines.
05
Insights
November–December 2025 discount rates peaked around 8–9% as gross margin fell to roughly 31%. December category margins were about 2–5 percentage points below September, supporting heavier discounting as a likely contributor rather than a shift toward lower-margin categories.
In 2026, June growth fell below 1%, July turned negative, and August rebounded to about 23%. June’s slowdown was concentrated in South, with all three stores showing roughly 50–90% YoY revenue declines. July’s recovery in South was uneven while weakness spread across other physical regions. These patterns identify where performance deteriorated; the data does not establish operational causes.
06
Outcome
Delivered a Power BI report, source workbook, dashboard preview, and documented findings. Unfiltered report totals were reconciled: $2,972,691.45 revenue, $993,807.45 gross profit, 33.43% gross margin, $166,448.55 discount value, and a 5.30% discount rate. The 501 unique customer IDs include the Unknown Customer record.
Regional target-achievement reporting was deliberately excluded: Online sales belong to a generic WEB store in Digital, while Online targets are allocated to physical regions. Company-wide Online and regional In-Store/Click & Collect comparisons are supportable; regional Online and overall regional comparisons are not.
Inventory, staffing, closures, and campaign data would be needed to investigate root causes. No implemented business impact is claimed.