CASE STUDY 02 / SQL · EXCEL · RELATIONAL MODELLING
Customer Support Operations Analysis
SQL analysis and Excel reporting across 4,200 synthetic support tickets, investigating SLA compliance, escalations, service quality, and workload.
Completed project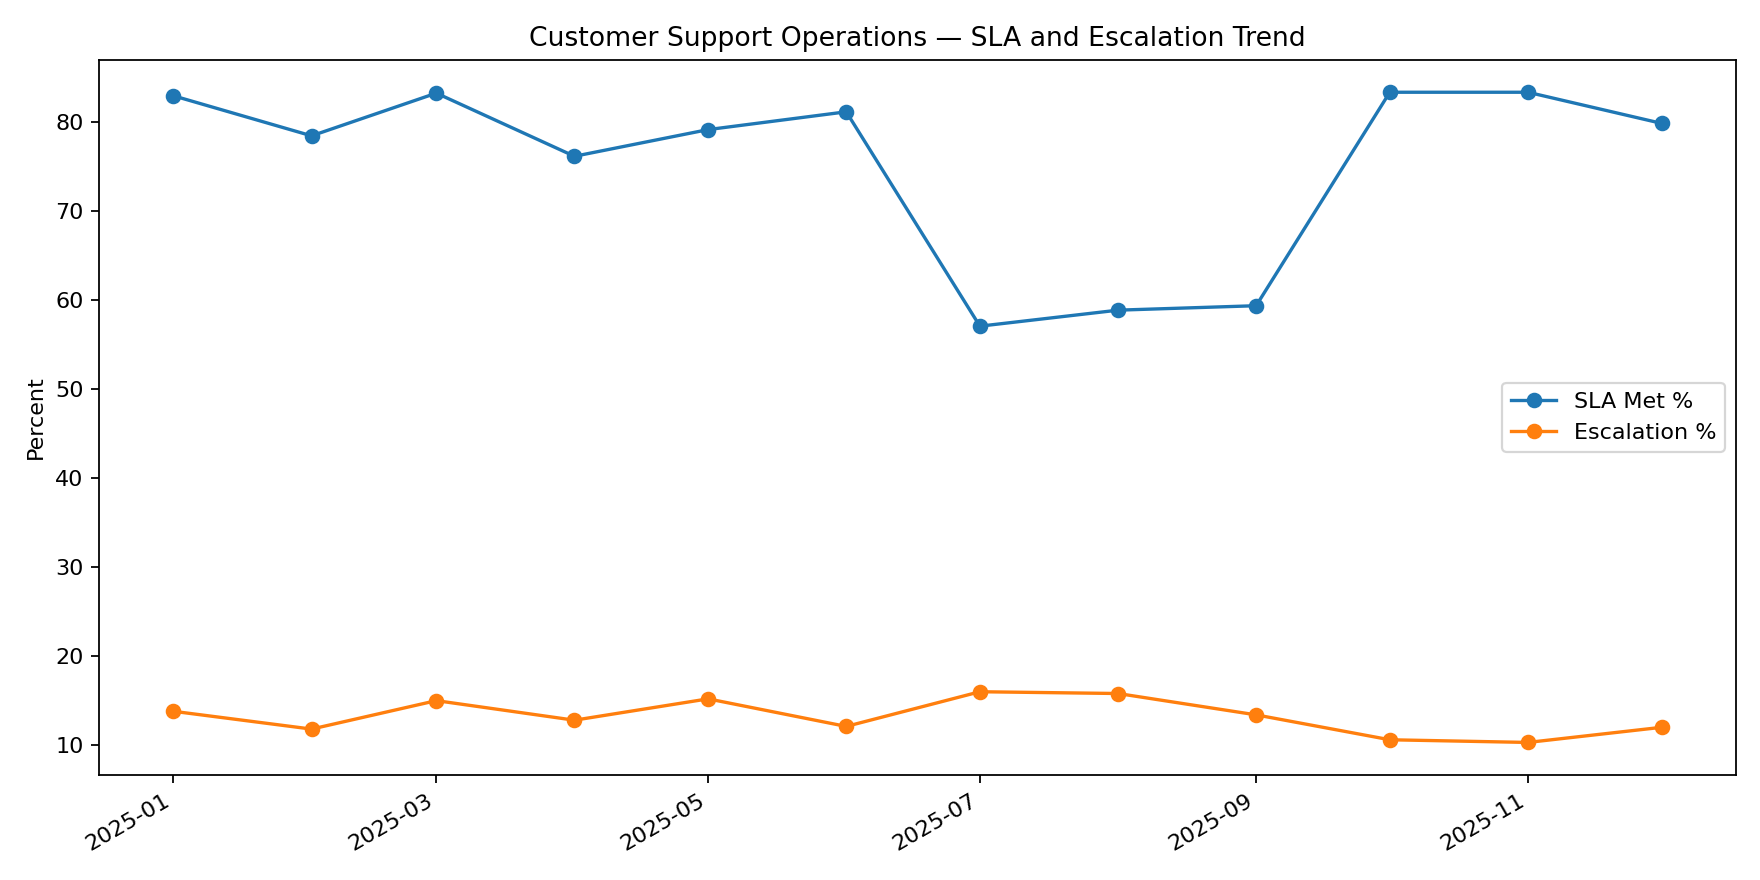
01
Problem
How do ticket volume, SLA compliance, escalations, and customer satisfaction change over time? Which issue categories, agents, and customer/channel combinations warrant closer operational attention?
02
Data
4,200 synthetic support tickets from 2025. Tickets form the fact table, with agents, customers, and categories as lookup tables. Source CSV files are supplied with the project. Findings describe a simulated support operation, not Concentrix or any real company.
03
Approach
Used SQL as the analysis layer and Excel as the reporting layer. Joined ticket records to category, agent, and customer lookups; grouped operational measures by month, issue category, and customer segment/channel. An agent-performance CTE summarizes workload and service quality, while a window function calculates each category’s share of escalations.
04
Analysis
Compared monthly ticket counts, average resolution hours, SLA compliance, escalation rates, and average CSAT. Category summaries expose issue-level pressure, and the agent analysis places ticket volume alongside resolution time, SLA attainment, and satisfaction rather than ranking performance by volume alone.
05
Insights
July–September averaged 58.5% SLA compliance compared with 80.9% in other months. Escalations averaged 15.1% during that period versus 12.6% otherwise.
Technical Issue had the lowest category-level SLA compliance at 70.4%. The mid-year deterioration coincided with slower resolution and more escalations, suggesting an operational-pressure period rather than a ticket-volume change alone. These associations do not establish a staffing or process root cause.
06
Outcome
Delivered an Excel operations report, SQL queries, source CSVs, and a monthly trend visual. The analysis identifies a period and issue category for further investigation, demonstrating relational modelling, joins, grouped KPIs, a CTE, and a window function.
The dataset is synthetic. No improvement to real-world SLA compliance, customer satisfaction, or business outcomes is claimed.